
The difference is not simply a data error: CPCB uses India’s National AQI, a 24-hour, multi-pollutant index capped at 500, while many private platforms use the US AQI formula, hourly data and sometimes low-cost sensors.
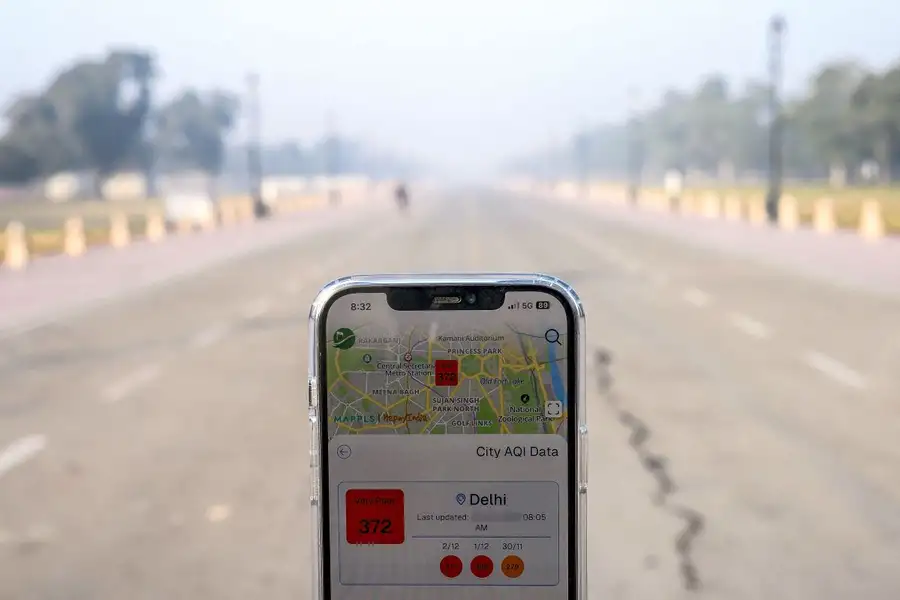
Delhi’s air-quality readings can differ dramatically because the government and private apps are often not publishing the same kind of number. The official figure is an India-specific, multi-pollutant index built from reference-grade monitoring stations and capped at 500, while several private platforms use the US AQI formula, different averaging windows, and sometimes low-cost sensor data -- so the same pollution episode can produce sharply different readings.
During the recent post-Diwali pollution episode, the Central Pollution Control Board (CPCB) reported a 24-hour citywide AQI of about 370–376, while private platforms showed figures several times higher: AQI.in reported 955 under US standards and 787 under an Indian-standard calculation; some hyperlocal readings crossed 1,000.
The gap is not necessarily evidence that one source is “wrong” in every respect. It reflects a deeper problem: “AQI” is a calculated communication tool, not a single physical measurement, and different systems can convert the same underlying concentrations into very different scores.
Government methodology
India’s National Air Quality Index (NAQI), used by CPCB, converts measured concentrations of eight pollutants -- PM2.5, PM10, nitrogen dioxide, sulphur dioxide, carbon monoxide, ozone, ammonia and lead -- into individual sub-indices. The highest sub-index, not an average of all pollutants, becomes the station’s overall AQI.
The formula is linear and segmented: for each pollutant, the concentration is placed between two health-based “breakpoints,” then mapped to the corresponding AQI range. In simplified form:
CPCB requires data for at least three pollutants, one of which must be PM2.5 or PM10, and considers at least 16 hours of data necessary for a sub-index. Its scale runs from 0 to 500: 0–50 is Good, 51–100 Satisfactory, 101–200 Moderate, 201–300 Poor, 301–400 Very Poor, and 401–500 Severe.
Why official numbers stop at 500
A central reason for the apparent mismatch is the ceiling. CPCB’s index tops out at 500; once PM2.5 or another pollutant crosses the concentration associated with that ceiling, the public AQI remains at 500 or “500+,” even if concentrations continue to rise.
Experts cited in recent reporting note that CPCB’s severe category corresponds to about 450 micrograms per cubic metre of PM2.5 under its framework. Thus, an official reading of 500 does not mean pollution has stopped increasing; it means the official index has reached the top of its designed communication scale.
Private apps use another ruler
Many widely used private platforms, including IQAir, use the US Environmental Protection Agency's AQI methodology. That system uses different pollutant breakpoints and can produce values above 500 during extreme episodes, which is why apps may display 1,000, 1,700 or even higher during severe smog.
The two systems also classify the same number differently. India labels 301–400 “Very Poor” and 401–500 “Severe”; the US-style scale calls 151–200 “Unhealthy,” 201–300 “Very Unhealthy,” and above 301 “Hazardous.” A reading of 400 therefore means different things on the two scales, even though both are intended to communicate health risk.
| Feature | CPCB / Delhi government | Many private apps |
|---|---|---|
| Index standard | India’s National AQI | Often US EPA AQI; some use proprietary methods |
| Pollutants | PM2.5, PM10, NO2, SO2, CO, O3, NH3, Pb | May focus chiefly on PM2.5 or use a different pollutant set |
| Overall score | Highest pollutant sub-index | Depends on platform formula and data-processing rules |
| Averaging | Generally 24-hour averages for PM2.5/PM10; eight-hour averages for CO and ozone | Often hourly or near-real-time values |
| City average | Average of AQI values from stations reporting that hour | May use a median of hourly station data or another aggregation method. |
| Upper limit | 500 | Can exceed 500 |
| Instruments | Primarily reference-grade continuous monitoring stations | May mix government data with low-cost sensors |
IQAir, for example, says it aggregates station data into hourly averages and uses the median of hourly concentration data from stations within a city area for its city-level AQI+. That can make its number more responsive to a short-lived spike -- such as fireworks smoke, a temperature inversion, or a local emissions burst -- than a 24-hour official average.
This is why a resident may see an app reading above 1,000 while the government portal reports a citywide severe reading below 500: they may be comparing a hyperlocal, hourly, US-scale estimate with a citywide, 24-hour, India-scale index.
Sensors add another layer
Government continuous ambient air-quality monitoring stations generally use reference-grade analysers and established calibration procedures. Private platforms may supplement these with lower-cost sensors, which can expand coverage but are more sensitive to placement, humidity, maintenance, calibration and local interference.
Experts quoted in recent coverage said private agencies do not always average readings in the same way, and low-cost sensors can report unusually high values under certain weather conditions. That does not make every private reading invalid, but it means such numbers should be treated as indicative rather than regulatory measurements.
What the discrepancy means
The official CPCB number remains the recognised index for public dissemination and regulatory reporting in India; other AQI figures are not treated as official regulatory values. But the official 500 cap can understate the visual and health intensity of an extreme pollution spike, while private apps can overstate the citywide picture if they foreground a single polluted location or an unrepresentative sensor.
For residents, the most useful comparison is not “which app shows the biggest number,” but whether the underlying PM2.5 concentration, monitoring location, timestamp and index standard are comparable. A 955 US-AQI reading and a 370 Indian-AQI reading can both describe dangerously polluted air; they simply answer the question using different rulers, clocks and maps.
The controversy points to a communications gap as much as a scientific one. Government portals could make the 500 cap, the 24-hour averaging window and the station-level data behind city averages more visible, while private apps should prominently label whether a figure is US AQI, Indian NAQI, hourly or 24-hour, and whether it comes from a reference monitor or a low-cost sensor.
Until then, Delhi will continue to see two apparently incompatible realities: an official severe AQI near the ceiling of India’s scale, and app readings in the thousands that capture the raw intensity of a pollution emergency through a different mathematical lens.
Published: 10 Nov 2026, 12:22 pm IST


Related Topics
Disclaimer: Kindly avoid objectionable, derogatory, unlawful and lewd comments, while responding to reports. Such comments are punishable under cyber laws. Please keep away from personal attacks. The opinions expressed here are the personal opinions of readers and not that of Mathrubhumi.
