Ganga cleanup: Progress is real, but warnings cannot be dismissed
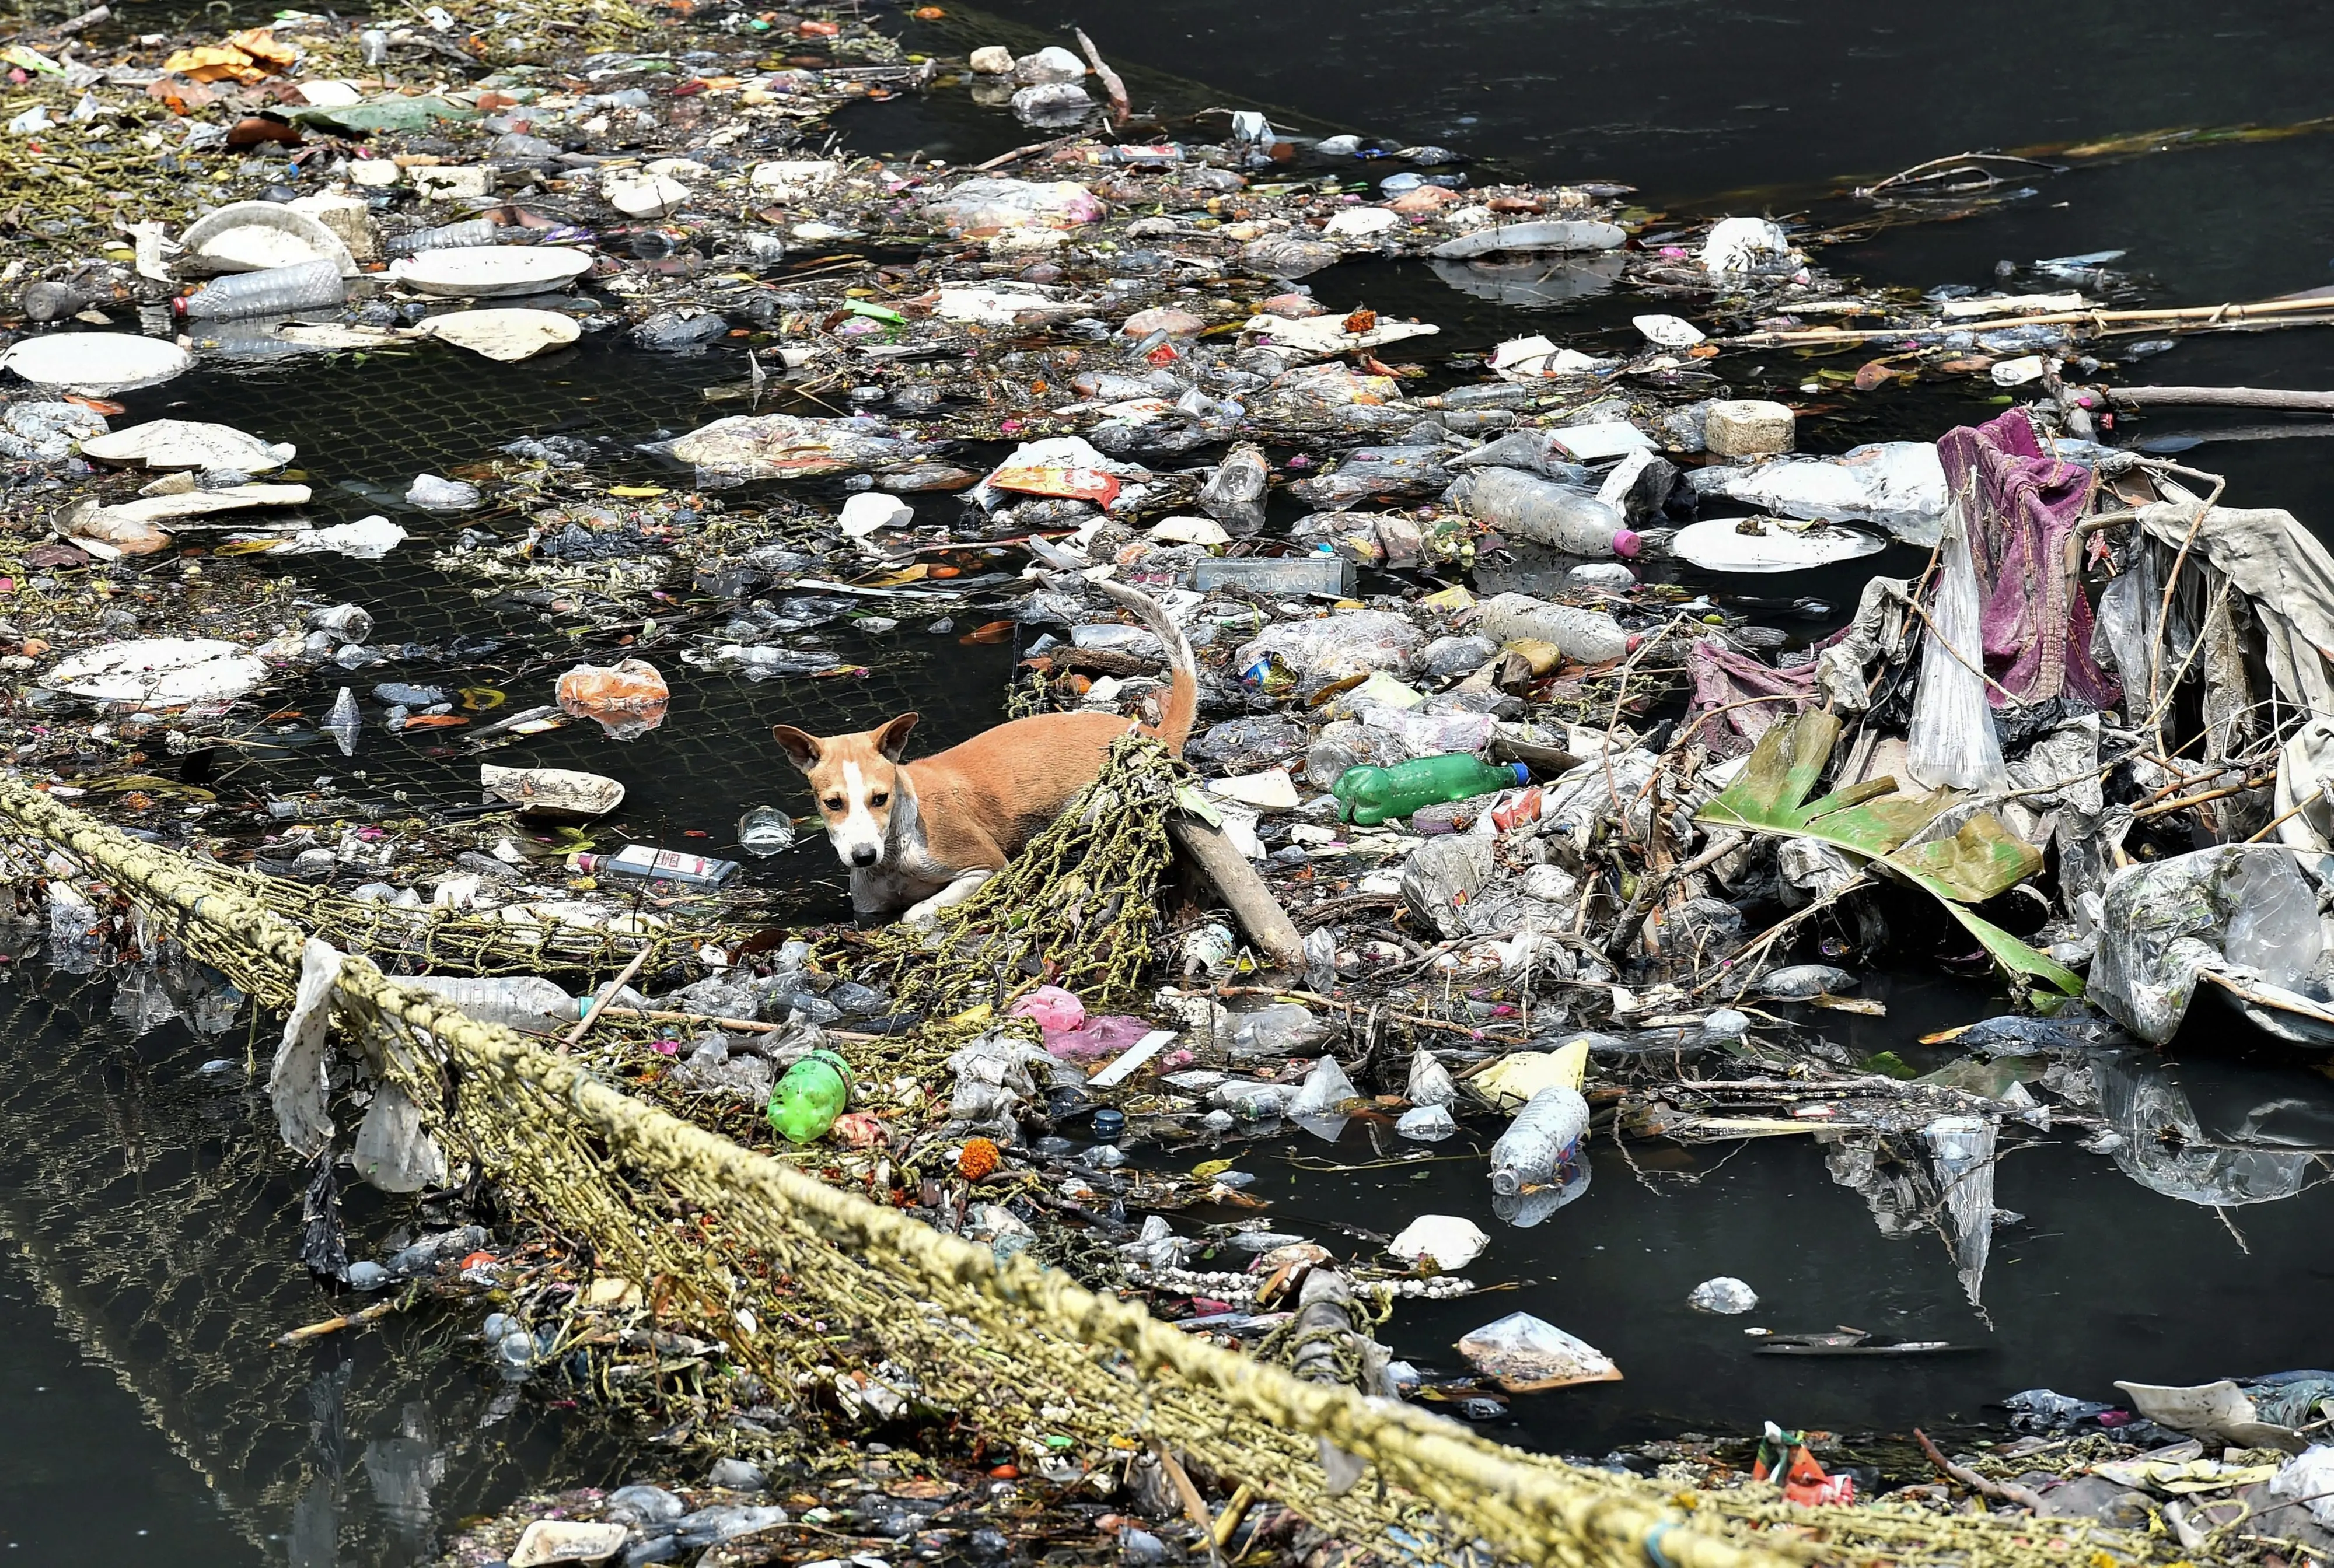
New Delhi: Has a decade of spending under Namami Gange made the Ganga cleaner? A recent Bloomberg investigation says the evidence is less encouraging than official claims suggest. It points to satellite indicators of turbidity, algae and surface temperature, along with water samples from 12 locations around Kanpur and Varanasi, to argue that pollution remains a serious problem.
The government’s response is that the Ganga cannot be judged through a handful of satellite observations and samples from a dozen places. It says the river has improved in several stretches, sewage-treatment capacity has expanded sharply and industrial pollution has fallen. But it also concedes that pollution persists in parts of Uttar Pradesh, treatment capacity still lags sewage generation, and enforcement must continue.
Both positions contain part of the truth. The Ganga has seen measurable progress in some places. But it remains a river under severe pressure, and the cleanup is far from complete.
What Bloomberg found
Bloomberg’s investigation questions whether Namami Gange has delivered a meaningful improvement in the Ganga’s water quality. It uses satellite-based indicators -- turbidity, algae and surface temperature -- and water samples from 12 locations around Kanpur and Varanasi to assess pollution trends.
The report’s central implication is that the river remains dirty, and that official claims of progress may not fully reflect conditions on the ground. It raises concerns about whether the programme’s spending and infrastructure have translated into cleaner water across the Ganga basin.
It also highlights the need to examine whether the cleanup can be independently verified, whether pollution data are complete, and whether the scale of investment has produced measurable environmental outcomes.
A river is not a snapshot
The government's response is that the Ganga cannot be assessed through a small number of satellite images or water samples from 12 locations. A river that flows nearly 2,500 km through five states, receives water from major tributaries and passes through vastly different ecological zones requires a wider assessment.
The Ganga is not a uniform channel. It begins in the Himalayan glaciers, passes through very different geological, climatic and hydrological zones, and receives water and sediment from the Yamuna, Ghaghara, Gandak, Kosi, Gomti and Son. Each tributary changes the river’s physical and chemical character.
A proper assessment requires monitoring across seasons and stretches, an honest account of pollution sources, a record of infrastructure built and whether it works, and measurable outcomes that can be checked over time.
What satellites can and cannot show
Satellites are useful for observing the surface of water across large areas and long periods. They can identify broad patterns in turbidity, algae and surface temperature, and help flag areas that may need closer examination.
But satellite readings are indicators, not direct measurements of water quality. They cannot establish biochemical oxygen demand, chemical oxygen demand, dissolved oxygen or microbiological parameters. Those require field sampling and laboratory analysis.
A satellite reading becomes meaningful only when it is calibrated and validated against field data. Without that validation, it offers a partial view of the river rather than a complete assessment.
Muddy water is not polluted water
Turbidity measures how muddy water appears because of suspended particles such as silt, clay, sand and organic matter. It does not identify whether those particles are sewage, industrial effluent or naturally occurring sediment.
The clearest example is at the river’s source. A study by the National Mission for Clean Ganga and the National Environmental Engineering Research Institute recorded turbidity above 600 NTU at Gomukh and Gangotri, caused almost entirely by natural glacial sediment.
Read by turbidity alone, the river’s source would appear as troubled as a polluted urban stretch. But the cause is natural glacial sediment, not sewage or industrial pollution.
Turbidity can also rise because of soil erosion, rainfall, monsoon runoff, glacial melt and disturbance of the riverbed or banks. Human activity such as dredging and construction near the banks can add to it. Conversely, water that looks clear may still carry dissolved pollutants or pathogens.
Turbidity must therefore be read alongside other parameters and laboratory results, not treated as a substitute for them.
Temperature varies naturally
Water temperature along the Ganga depends on altitude, glacial melt, air temperature, sunlight, depth, flow and season. The Central Pollution Control Board’s Biological Health of River Ganga study recorded temperatures ranging from 10.5°C to 37.5°C across the river and its tributaries.
Near Gomukh and Gangotri, water temperature may remain close to 0–5°C. Downstream stretches can cross 30°C during summer. Comparing surface temperatures across Uttarakhand, Bihar and West Bengal without accounting for these natural differences says little about pollution.
The same applies to sediment. Unregulated sand and gravel extraction can disturb sediment and raise turbidity. But excessive natural accumulation of sand and gravel can also raise the riverbed, alter flow and reduce the river’s capacity to carry floods.
The goal is scientifically assessed and sustainable sediment management, not indiscriminate extraction. Both uncontrolled harvesting and unchecked accumulation can harm the river.
The parameters that matter
River health is assessed through a set of established parameters, each revealing a different aspect of water quality.
Dissolved oxygen is the oxygen available to fish and other aquatic life. It responds to organic pollution, temperature, flow and photosynthesis. Its depletion is one of the clearest signs that a river is under stress.
Biochemical oxygen demand measures the oxygen microorganisms need to break down biodegradable organic matter. It is a key marker of sewage pollution.
Chemical oxygen demand measures the oxygen equivalent of chemically oxidisable substances, covering organic and other pollutants. pH indicates whether water is acidic or alkaline and whether it can support aquatic life. Ammonia and nutrients reveal sewage inputs and the risk of nutrient enrichment.
Dissolved oxygen deserves particular attention. It must be examined along the river’s entire length, across seasons and monitoring locations, to understand the true condition of its aquatic environment.
An assessment based mainly on turbidity, algae and surface temperature, without adequate attention to dissolved oxygen and other tested parameters, offers only a partial picture. Satellites can supplement field monitoring, but they cannot replace it.
Biology tells another story
Water chemistry is not the only test of river health. Biomonitoring examines the organisms living on the riverbed, which reflect pollution conditions over months rather than on the day a sample is collected.
CPCB’s biomonitoring in 2025 and 2026 covered 42 locations on the Ganga and its tributaries, and 26 locations on the Yamuna system. It found biological water quality ranging mostly from good to moderate.
The diversity of benthic macroinvertebrates recorded during these assessments suggests a river capable of sustaining aquatic life. These biological indicators complement chemical monitoring and provide a longer-term view of ecological health.
Twelve locations or 112?
The water samples cited in the investigation came from 12 locations around Kanpur and Varanasi. They provide real insight into those places, but they cannot describe a river that crosses five main-stem states and an enormous range of geographic, ecological and urban settings.
A robust assessment requires consistent sampling across locations, seasons and years, with clearly stated methods, parameters and historical comparisons.
That is what the CPCB network provides. It monitors water quality manually at 112 locations along the Ganga’s main stem: 19 in Uttarakhand, 41 in Uttar Pradesh, 33 in Bihar, four in Jharkhand and 15 in West Bengal.
In addition, 40 real-time monitoring stations on the Ganga and its tributaries track 12 parameters and report every hour. This wider network allows trends to be examined across the basin rather than relying on a small number of locations.
Kanpur to Varanasi: critical but improving
The Kanpur-Varanasi stretch remains one of the most important sections for Namami Gange because of its historical pollution load from large cities, industry and untreated sewage. It remains a priority.
But CPCB records show change over time. The board grades polluted stretches into five priority classes based on biochemical oxygen demand. Class I represents BOD above 30 mg/L, while Class V represents BOD between 3 and 6 mg/L -- the last step before the desirable level of below 3 mg/L.
In CPCB’s polluted river stretch assessment, the Kanpur-Varanasi stretch was in Priority Class III in 2015, with BOD between 10 and 20 mg/L. By 2022, it had moved to Priority Class V, with BOD between 3 and 6 mg/L. That represents a substantial reduction in organic pollution.
The 2025 assessment shows further partial improvement in Uttar Pradesh. The earlier Kannauj-Varanasi listing is now identified as Bijnor to Tarighat, although some locations in the state still exceed the bathing-water criterion for BOD.
Observations from Kanpur and Varanasi matter for understanding local conditions. But they should not be generalised to the entire Ganga, nor read without the improvement documented over time.
What CPCB’s 2025 data shows
CPCB’s assessment of median water quality for January to August 2025 found that pH and dissolved oxygen met prescribed bathing-water criteria at every monitored location on the Ganga.
BOD met the bathing-water criterion along the main stem in Uttarakhand, Jharkhand, Bihar and West Bengal. Certain stretches in Uttar Pradesh still require intervention, including locations around Farrukhabad and Kanpur, Dalmau to Rae Bareli, and downstream of Mirzapur towards Tarighat in Ghazipur.
CPCB’s polluted river stretch assessments of 2018 and 2025 record improvement in some states while identifying stretches that still need action. Both findings belong in an honest account of the river.
The promising results are also reflected in the saprobic scale used in biomonitoring, which assesses the biological condition of water bodies.
Sewage remains the biggest challenge
Sewage from towns and cities along the river accounts for about 70 per cent of the pollution entering the Ganga. It has therefore received the largest share of attention under Namami Gange.
The approach has been to map every town along the river, assess existing treatment plants, and then rehabilitate, upgrade or build new capacity designed for a 15-year horizon and matched to projected population in 2035.
As of August 2026, 219 sewerage infrastructure projects had been sanctioned under Namami Gange, with a combined treatment capacity of 6,603 million litres per day. The programme also includes a planned sewer network of 5,245 km and the tapping of about 300 untapped drains.
Of these projects, 147 had been completed, creating 4,342 MLD of treatment capacity and 4,617 km of sewer network. These are substantial interventions spread across the basin.
In the five years from 2021 to 2026 alone, completed projects added about 3,400 MLD of treatment capacity.
The remaining gap
The gap remains real. The five main-stem states generate around 10,160 MLD of sewage. A December 2025 government update reported available treatment capacity of about 7,820 MLD, with projects adding another 1,996 MLD at various stages of implementation.
That is why the work cannot end with building treatment plants. Sewer connections, pumping stations, plant utilisation, maintenance and compliance with discharge standards matter just as much.
The real test is whether sewage is actually collected, treated and safely managed—not merely whether a plant has been sanctioned or constructed.
Where capacity is complete, the river responds
When a town reaches full treatment capacity, with sewers, interception and diversion works and treatment plants operating properly, the river downstream can improve.
Haridwar is the clearest example. CPCB’s 2018 polluted river stretch assessment placed the Ganga below Haridwar in Priority Class IV. It later improved to Priority Class V and was then removed from the list of polluted stretches altogether.
Similar improvement has been recorded in the Kanpur-Varanasi stretch. Jharkhand’s main Ganga stem is now described as saturated with treatment infrastructure. Sustained pollution abatement, built and properly operated, produces measurable change.
Kanpur’s two pollution streams
Kanpur has long faced pollution from two directions: domestic sewage and tannery wastewater. Namami Gange has addressed both.
The Sisamau Nala, one of Kanpur’s largest drains, once discharged untreated sewage directly into the Ganga. It has now been intercepted and diverted for treatment. Its tapping removed a major source of direct discharge and remains one of the most visible results of the programme on the ground.
A dedicated 20 MLD common effluent treatment plant now serves the Jajmau tannery cluster. It includes chromium-recovery infrastructure designed to recover chromium from tannery wastewater and reduce its release into the environment.
A second CETP at Mathura, with a capacity of 6.25 MLD, is complete. A third at Banthar, with a capacity of 4.5 MLD, is under way.
Industry under scrutiny
Annual inspections of grossly polluting industries began in 2017 and are carried out through independent technical institutions. The 2025 inspection cycle covered 3,703 units across the Ganga and Yamuna basins.
For the Ganga basin, the latest government assessment records three clear shifts. Industrial compliance rose from 39 per cent in 2017 to 86 per cent in 2025. The BOD pollution load from industry fell from 26 tonnes a day to 12 tonnes a day. Industrial effluent discharge declined from 349 MLD to 274.88 MLD.
These are substantial reductions in industrial pollution load. They also show why inspection and enforcement must continue.
Monitoring industry involves more than visual checks. It includes assessment of effluent-treatment systems, sampling and laboratory analysis of treated effluent for BOD, COD, total suspended solids and flow, verification of online continuous monitoring systems, and detection of unauthorised bypasses or untreated discharge.
Units found non-compliant face regulatory action by State Pollution Control Boards, ranging from notices and corrective directions to closure orders where warranted.
A technology-led approach is also being piloted in selected projects. Effluent quality and operating parameters are monitored remotely through online sensors, while live video surveillance is integrated with sensor data. The video provides an independent check on sensor readings, helping expose discrepancies, manipulated readings and hidden bypass arrangements.
Data that can be checked
A fair question raised by the investigation is whether the cleanup can be independently verified. The monitoring architecture is designed to allow that.
PRAYAG, the Platform for Real-time Analysis of Yamuna, Ganga and their Tributaries, has been live since April 20, 2023. It brings together the Ganga Pulse Portal, a project-monitoring dashboard and an open public-access platform.
As of the latest available information, 281 sewage-treatment plants had been mapped on the platform, and 233 were sending real-time data through online continuous effluent monitoring systems.
The Ganga Knowledge Portal, built in-house by the National Mission for Clean Ganga, is open to students, researchers and the public. It contains 1,408 documents, including research reports, district river maps, a river atlas and sewage-treatment-plant performance datasets.
More data can always be opened up. But the foundation of a transparent and verifiable record is already in place, and it continues to expand.
Groundwater is a separate issue
Fluoride and arsenic in drinking water are serious concerns in parts of Uttar Pradesh. These contaminants often arise from the natural geology of the aquifer, though human activity can contribute in some cases.
It is important to keep two questions separate. Fluoride or arsenic found in groundwater because of natural geological conditions does not, by itself, show that the Ganga or its tributaries are polluted.
Geogenic contamination belongs to the rock that holds the aquifer. Conventional river-pollution abatement cannot remove it.
What protects people is safe drinking water. The Uttar Pradesh government reports that habitations are affected by water-quality issues including arsenic, fluoride, iron, salinity and nitrate. Community water purification plants have been installed as immediate relief, while the Jal Jeevan Mission works to provide functional household tap connections, with special attention to habitations affected by arsenic and fluoride.
Safe drinking water and scientific assessment of river water are both essential. But they are different questions, and treating them as one can lead to incorrect conclusions about both.
Beyond sewage: ecology matters
Namami Gange is not only a sewage-treatment programme. It also includes afforestation, wetland conservation, biodiversity protection, restoration of aquatic habitats and community participation.
State forest departments have planted around 33,024 hectares in the Ganga basin under Namami Gange since 2016. A further 59,850 hectares have been planted under CAMPA funding. Seven biodiversity parks now cover 482 hectares across seven districts of Uttar Pradesh.
The river’s wildlife provides another important indicator. The first countrywide assessment of river dolphins, led by the Wildlife Institute of India with state forest departments, estimated about 6,327 Gangetic dolphins in Indian rivers. The Ganga basin supports the largest share, with 6,324 dolphins.
That is more than double the 2009 baseline of 2,500 to 3,000 dolphins. Since 2017, more than 205 lakh fingerlings of Indian major carp have been ranched in the Ganga to restore fish stocks, rebuild the dolphin’s prey base and support fishers.
India’s first dolphin rescue ambulance entered service in January 2026. Eight Gangetic dolphins have since been rescued and released. Six aquatic-species rescue and rehabilitation centres now operate across the basin.
These ecological indicators complement water-quality monitoring and tell their own story about the river.
The river beneath the river
The Ganga’s flow depends on rainfall, tributary inflows, snow and glacial melt, and groundwater. Groundwater and river water interact differently by place and season. In some stretches, aquifers feed the river. In others, the river recharges the aquifers.
Excessive groundwater extraction lowers aquifer levels and reduces the water they return to the river, especially during the lean season.
Recognising this, aquifer mapping and paleochannel recharge are under way in the Ganga-Yamuna Doab. A managed aquifer recharge project has been approved to use ancient river channels, known as paleochannels, along the Prayagraj-Kanpur stretch.
The project will identify suitable recharge sites, build scientifically designed recharge structures and monitor groundwater levels and outcomes over two hydrological cycles.
River rejuvenation must therefore look beneath the visible surface, to the aquifers and natural systems that sustain the river’s flow.
Legal protection for flow
The Government of India notified minimum environmental flows for the Ganga from its origin to Unnao on October 9, 2018. Environmental-flow assessments are under way for nine more river basins, including the Son, Ghaghara, Gomti, Gandak and Kosi.
Maintaining environmental flow is essential because a river cannot be restored merely by treating sewage if its natural flow is reduced or disrupted.
Pressures beyond drains
The Ganga also faces pressures that no single drain or treatment plant can solve. Rapid urbanisation, population growth and industrial expansion continue to raise sewage generation and water demand.
Encroachment on floodplains, sand mining, construction, changing land use and excessive groundwater extraction add further strain.
These challenges are interconnected. They require coordinated action by state governments, urban local bodies, pollution-control authorities, groundwater agencies and other institutions, working alongside Namami Gange.
A structure for coordination
That coordination has an institutional structure. A five-tier framework runs from the National Ganga Council, chaired by the Prime Minister, through the Empowered Task Force chaired by the Union Minister of Jal Shakti, the National Mission for Clean Ganga and state Ganga committees, down to 139 district Ganga committees led by district magistrates.
By May 2026, these district committees had held more than 5,852 meetings, tracked through a digital performance dashboard.
The work also reaches villages and city planning. All 4,507 identified villages on the Ganga’s banks in the five main-stem states have household toilets and are declared open defecation-free. Of these, 4,254 have achieved ODF Plus status.
Urban river management plans have been developed for 13 cities in the first phase, including Haridwar, Rishikesh, Prayagraj and Mirzapur, so that cities plan with the river rather than around it.
A national framework for the safe reuse of treated water now guides states. Uttarakhand, Uttar Pradesh, Bihar and West Bengal have notified their policies. The Mathura refinery already draws 8 MLD of treated water from the Trans-Yamuna sewage-treatment plant.
Reading the budget correctly
As of September 2026, 531 projects worth ₹43,064 crore had been sanctioned under Namami Gange, and 371 had been completed.
That figure covers two phases, not one budget. The Union Cabinet approved Namami Gange in May 2015 with an outlay of ₹20,000 crore for 2015-2020. Namami Gange II followed in 2022 with ₹22,500 crore for 2021-2026.
Public discussion often confuses two different financial measures: sanctioned project cost and actual expenditure. Sanctioned project cost is the approved estimated cost of projects. Actual expenditure is the money spent on executing the work.
As of September 30, 2026, a total of ₹21,845 crore had been disbursed or spent to implementing and executing agencies since the programme began. This should not be confused with the sanctioned cost. What remains includes committed liabilities in the form of annuity and operation-and-maintenance payments.
Paying for performance
The Union Cabinet approved the Hybrid Annuity Model for sewage projects in January 2016, with full central funding. It was the first time this model was used in India’s sewage sector.
Under the model, a private partner builds the plant and then operates and maintains it. Only 40 per cent of the capital cost is paid when construction is complete. The remaining 60 per cent is paid as annuities over the life of the project, roughly 15 years, along with operation-and-maintenance payments. Both are linked to plant performance.
Thirty-eight projects worth ₹14,406 crore have been sanctioned under this model so far.
By design, the model records lower expenditure in the early years and spreads the larger share over 15 years. A low spending figure today is therefore partly a reflection of a payment model built around performance, not necessarily a sign that money is lying unused.
A fair assessment of value must therefore look at project-wise expenditure, completion milestones, utilisation records, operational performance and the quality of treated wastewater, rather than a single headline spending figure.
Progress and unfinished work
The evidence records improvement in several stretches of the Ganga, a large expansion of sewage-treatment infrastructure, a steep fall in industrial pollution load and meaningful ecological recovery.
It also records that pollution persists in certain stretches, that treatment capacity must keep pace with the sewage cities generate, and that industrial compliance and plant performance require continuous monitoring.
Both halves of that record are true, and both deserve to be stated.
In December 2022, at COP15 in Montreal, the United Nations named Namami Gange one of its Top 10 World Restoration Flagships. It was selected from more than 150 initiatives in 70 countries, and its progress is tracked through the UN’s restoration monitoring framework.
The Ganga’s rejuvenation is a long-term national effort. It cannot be reduced to isolated satellite observations, a handful of sampling locations or expenditure figures alone, Namami Gange concluded.